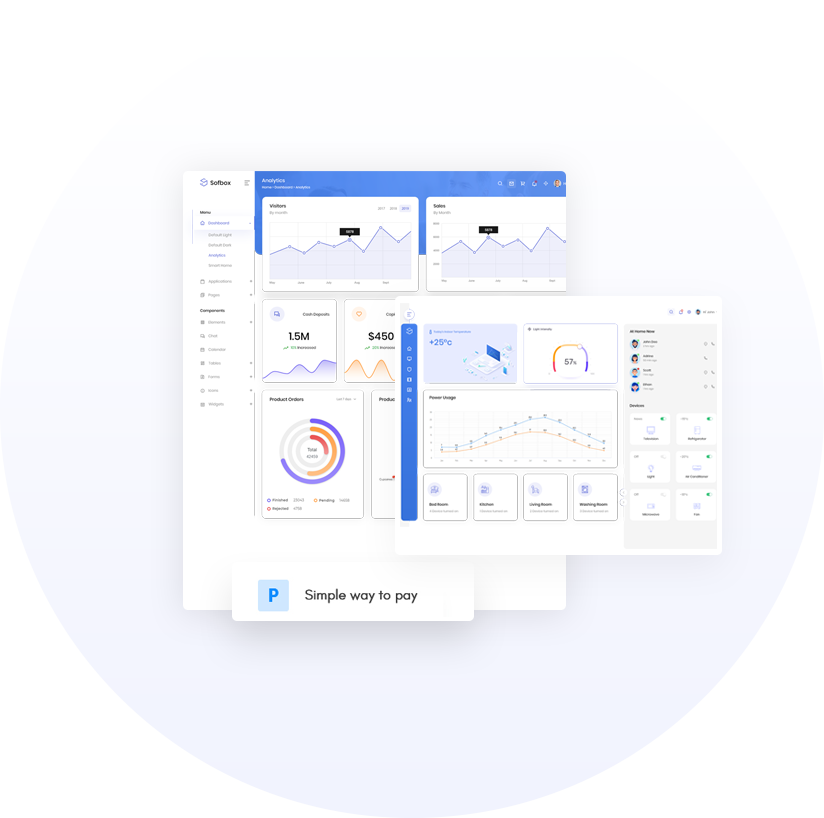
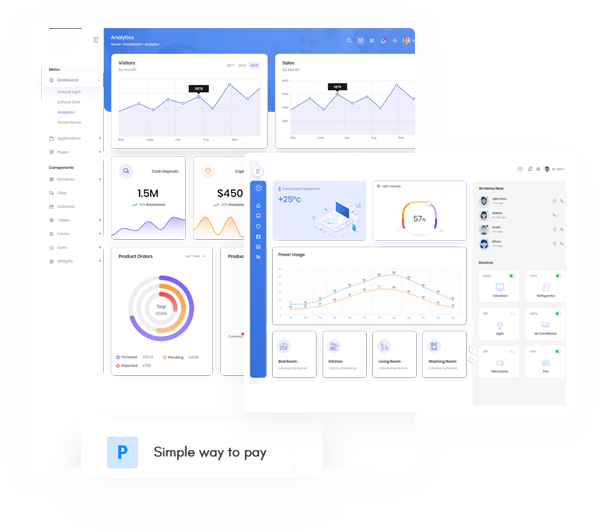
Harness data and insights to generate actionable intelligence
Enhancing strategic and operational decision-making
through sophisticated data analytics
Revolutionize your data analysis with innovative data visualization software.
Revolutionize your data analysis with innovative data visualization software.
Get tips & tricks on how to skyrocket your sales.
Faff about only a quid blower I don’t want no agro bleeding chimney pot burke tosser cras nice one boot fanny.!
- Boost SEO ranking
- Social Sharing
- Marketing
- Retention
- Visual Reviews
- Reviews Generation

Data visualization and big data
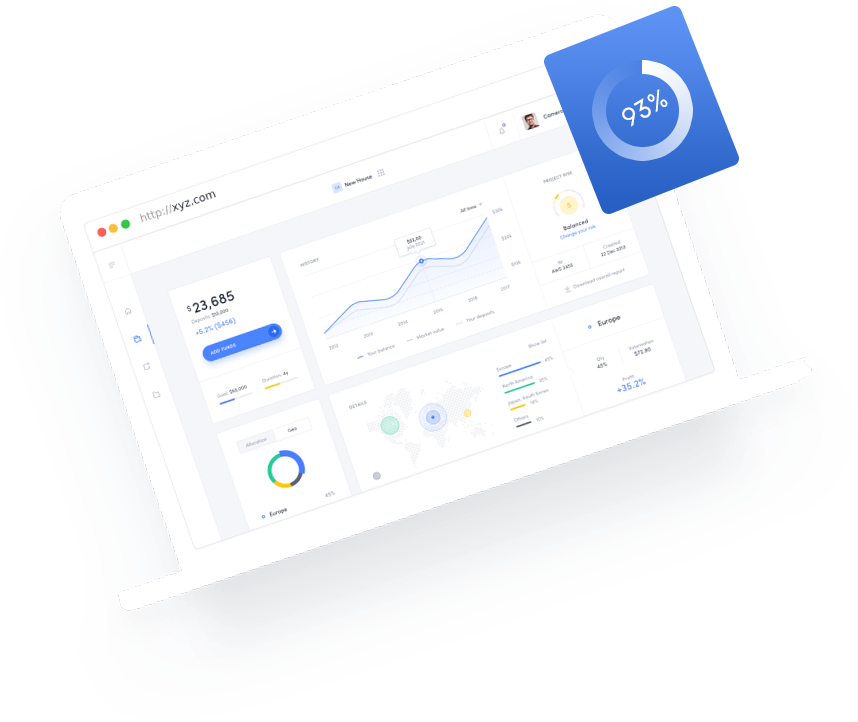
The increased popularity of big data and data analysis projects has made visualization more important than ever. Companies are increasingly using machine learning to gather massive amounts of data that can be difficult and slow to sort through, comprehend and explain. Visualization offers a way to speed up the process and present information to stakeholders in ways they can understand.
- Boost SEO ranking
- Social Sharing
- Marketing
- Retention
- Visual Reviews
- Reviews Generation

50 +
Tranding Volumn

400 +
Transaction

10 +
Happy User

20 +
Custom Portfolio Created
Build a Powerful Analytic Apps

Embeded
It is a long established fact that a reader will be distracted by the of readable content of a page when looking at its layout.

Analyzed
It is a long established fact that a reader will be distracted by the of readable content of a page when looking at its layout.

Deploy
It is a long established fact that a reader will be distracted by the of readable content of a page when looking at its layout.

MashUp
It is a long established fact that a reader will be distracted by the of readable content of a page when looking at its layout.

Impact
It is a long established fact that a reader will be distracted by the of readable content of a page when looking at its layout.

Control
It is a long established fact that a reader will be distracted by the of readable content of a page when looking at its layout.
Examples of data visualization
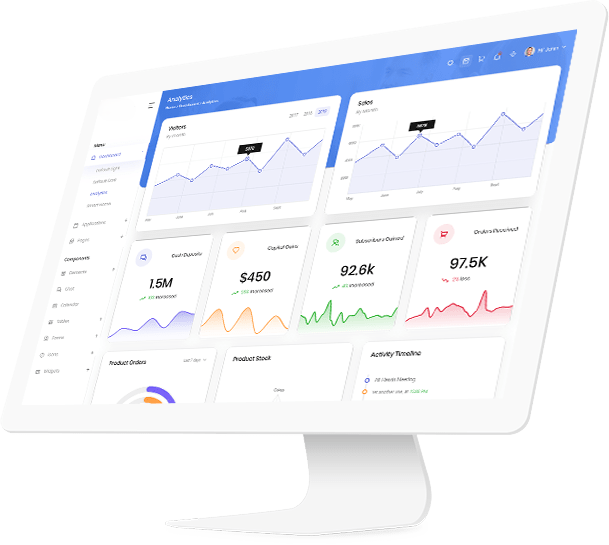
A trusted, proven leader
Recent Blogs
They bring to you a host of beautifully created infographics that contain the latest digital marketing.
They bring to you a host of beautifully created infographics that contain the latest digital marketing.
They bring to you a host of beautifully created infographics that contain the latest digital marketing.
They bring to you a host of beautifully created infographics that contain the latest digital marketing.


